A podcast on data and how it affects our lives — with Enrico Bertini and Moritz Stefaner
006 | On Food
Hi Folks!
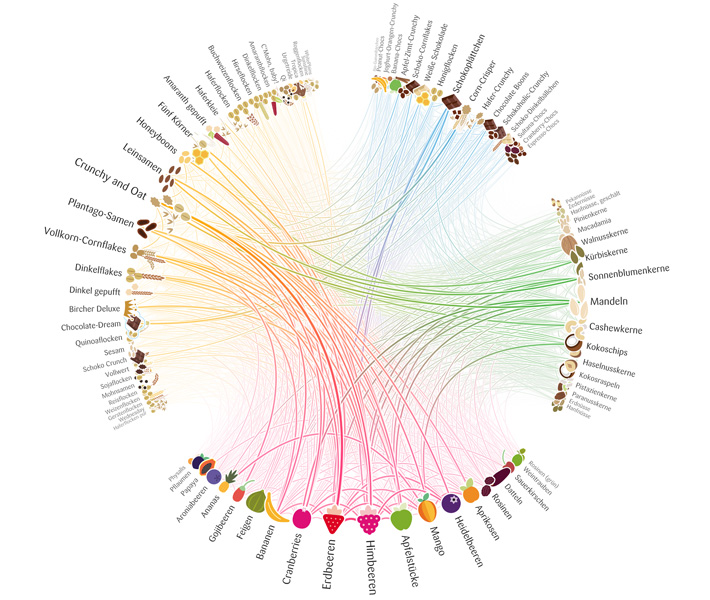
In this episode we talk about food. Food? Yes, food. Moritz recently created the Müsli Ingredient Network, a visualization of ingredient combinations in müsli, and we took this as an opportunity to talk about one of our favorite topics other than visualization, that is, food. But hey … there is a lot to visualize about food! Listen to the episode and you’ll see it.
Visualizations discussed in detail:
Episode breakdown:
[00:00] Intro
[02:18] Today’s topic – food!
[02:46] Moritz’s Muesli ingredient network
[10:13] Barabasi’s food ingredient analysis
[16:20] Are scientific papers the best way to communicate research?
[18:19] Food pairing website
[19:23] Visualizing food 40 ways
[21:02] How America spends food and drink spending per city
[22:49] Use food to represent data
[24:32] Personal data
[24:55] Nutrition data
[28:26] Self nutrition data
[30:25] Maragrida’s email: Data sexuals
[31:15] Big data – overrated?
[33:09] Hourly webcam shots
[34:57] Manually collected data
[36:20] Should you learn to code? (Sakshita’s comment)
[39:55] Wrapping it up
Links and Images:
- Barabasi’s Food Ingredient Analysis
- Moritz’s Muesli Network
- Food Pairing Tool
- Visualizing Food 40 Ways (the one w/ french fries bar charts :-))
- America’s Food and Drink Spending (by Interactive Things)
- Self Nutrition Data (food database with query visualization tools)
- USDA National Nutrient Database
—
As usual your feedback is more than welcome. And let us know if you intend to do some visualization with food data. Have fun!


